
Have you ever found yourself wondering if there’s a ‘right’ age to get married? A recent study by Hillier Jewellers has looked at the average age of marriage across the country to see at what stage in life people are likely to tie the knot.
If you’re planning a wedding, chances are you’ve looked back at family wedding photos and realised how young your parents or grandparents were on their wedding day. Now, it’s common for couples to wait until they’ve travelled the world or established themselves in their careers before deciding to take the next step. Back in the 70’s the average age of marriage was 28.6 for men and 29.5 for women, so how does it look over 40 years later?
The average age of marriage in the modern day
The study unsurprisingly showed that the average age of marriage has increased dramatically in the last 20 years alone, with men waiting till 34 and women till 31.5 in 1997 and now to 37 and 34.6 in 2017. Over 40 years, that’s an increase of 8.4 years for men and 5.1 for women!
So, why are we waiting longer to get wed? From a cultural standpoint, more people are choosing to cohabit with their partner before taking the plunge, something that wasn’t as common 40 years ago. With more opportunities for both men and women to further their education and careers, it could also be said that we’re more inclined to wait until the ‘right’ time, allowing for more money to be saved and a sense of stability gained before going ahead with a financially draining day!
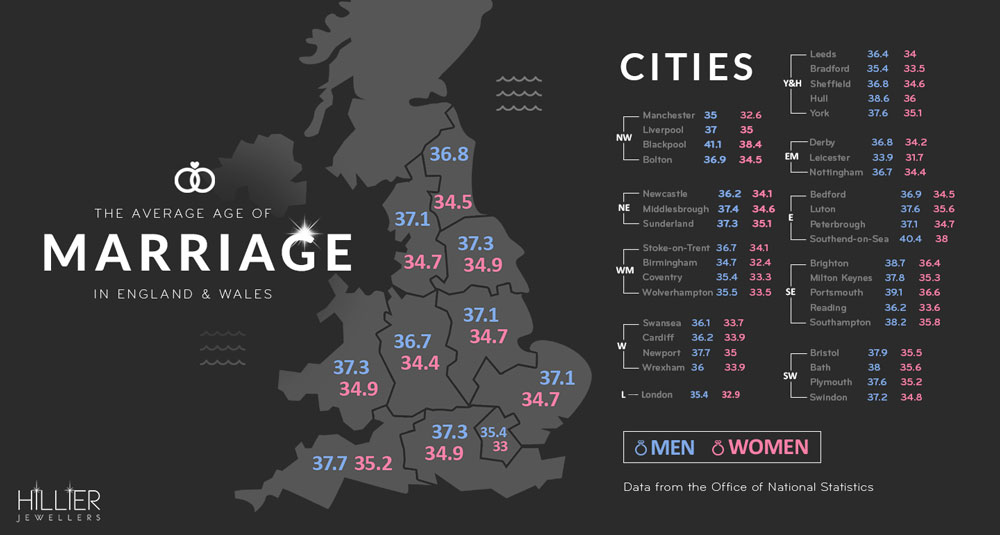
Hillers also looked at where in the UK the average ages have shifted the most - does where you live have an impact on when you will get wed? The data reveals that some of Britain’s most highly populated cities have the lowest average age of marriage, but there’s still a significant increase since the 1970s. Leicester sits at the bottom, with men and women getting married at 33.9 and 31.7, respectively. Other urban metropolises such as Manchester and London, come in a close second and third, with men getting married between the ages of 35 and 35.4, and women tying the knot at 32.6 and 32.9.
This confirms the theory that cosmopolitan areas offer more opportunities for advancement outside of marriage, plus with a higher living cost the increase in age for marriage could signify that it’s taking a lot longer to afford the big day!
Britain’s oldest wedding towns all lie by the coast. Blackpool leads the mature way with men
marrying on average at 41.1 and women at 38.4. Southend-on- sea and Portsmouth come in
next with both town’s men and women marrying above the ages of 39 and 36. Travel down to the South West and that’s where we find the region with the oldest newlyweds with men and women getting married, at 37.7 and 35.2. Is the coastal lifestyle the reason people choose to marry later or are economic reasons forcing couples to wait until later in life until the big day?
We asked Hiller Jeweller’s eCommerce manager, Lewis Hiller what he thought of the results: “It’s great to be able to showcase our Average Age of Marriage Map. Whilst the results weren’t too surprising in that we did suspect to see an increase - there’s a view now that people are getting married later and later - what is surprising is by how much this has increased. Men on average are waiting almost ten years longer to settle down, and with women it’s half that but still 5 years on top of the late 70s.”
To see what the average age of marriage is where you live, take a look at the full results in the Marriage Map.
Add new comment